Data

Estimating Foodprints

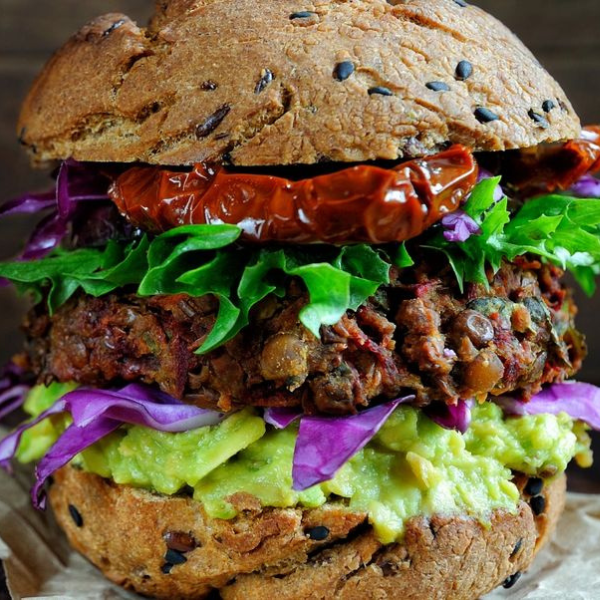
The Planetary Foodprint Calculator estimates the environmental impacts of a meal by computing a weighted sum of the individual impacts associated with producing each ingredient. This means the footprint of a black bean burger is determined by how much the impact of each ingredient (bun, patty, toppings, etc.) is contributing to a single meal.

closeup-of-veggie-burger-canva-600x600

Determining the Climate Score

A climate score is one way to compare and understand the impacts of various meals and make ingredient substitutions. Climate labels help consumers make more informed choices based on the environmental costs of food. This is especially true as the impacts of food are often less understood than those of energy or water use and tend to be drastically underestimated in the context of high-impact ingredients.

The Planetary Foodprint Calculator scores meals based on the amount of greenhouse gas emissions associated with producing each meal. Based on research compiled by the World Resources Institute and EAT Lancet, global greenhouse gas emissions associated with agriculture must be limited to 4-5 Gt CO2eq in 2050 to constrain global warming below 2°C and prevent irreversible, catastrophic changes to our climate. According to Poore and Nemecek (2018), the estimated food systems emissions in 2010 were 9.11 Gt CO2eq, not including emissions due to land use change, transport, retail, or processing, and are only projected to grow under existing systems and consumption trends.

  • To determine thresholds for the climate score, we assume that the food system will sustain the United Nations’ global projected population size for 2050 of 9.8 billion people, allowing us to approximate a per-person dietary emissions goal and, ultimately, a per-meal score. Given 365 days of eating per person, divided into three meals per day, our ideal measure for the GHG emissions per meal is 373 g CO2eq, or 0.373 kg CO2eq (0.816 lbs. CO2eq): a low, or green, climate impact.
  • Meals with a climate impact of over 0.4 kg 0.373 kg CO2eq (0.881 lbs. CO2eq) per meal, but less than 1 kg CO2eq (2.70 lbs. CO2eq) per meal, are scored yellow. The status quo based on emissions intensity in 2010 amounts to 1.03 kg CO2eq (2.70 lbs. CO2eq) per meal.
  • This sets the next score, orange, between 1.0-2.0 kg CO2eq (2.2 – 4.4 lbs. CO2eq), the “business-as-usual” case that would lead to a continued increase beyond the 5 Gt CO2eq limit.
  • Any meals with emissions above 2.0 kg CO2eq (4.4 lbs. CO2eq) are considered detrimentally high, marking the final red ranges.

This rubric was tested to assess whether common dishes can fall within the ideal range. Fortunately, many delicious and healthy meals fall below 0.4 CO2eq (1.1 lbs. CO2eq) per serving. For examples of climate-friendly meals and more insight into your own results, see Understanding Your Results.

digital-looking-earth-with-data-imagery-floating-around-it-canva-600x600

Climate Data

Greenhouse gas emissions data for each ingredient were sourced from a 2023 research paper by C. C. Ivanovich et al. which determined the average greenhouse gas emissions of over 90 basic ingredients and food categories using published life cycle analysis data. Most importantly, Ivanovich et al. break down these emissions by different greenhouse gases, allowing us to calculate both GWP100 and GWP20 values for each product or category.

In the production of food, greenhouse gas emissions include fuel use, chemical inputs such as nitrogenous fertilizers, land conversion, and the enteric fermentation of ruminant livestock (the gas-producing digestive process of animals like cows, sheep, and goats). Ivanovich et al. sourced CO2eq estimates from Poore and Nemecek (2018), who consolidated the environmental impacts of roughly 38,000 farms that represent a diversity of global production systems and ingredients. Ivanovich et al. break down the total emissions results by greenhouse gas based on 115 peer-reviewed studies that report the percentages of each gas emitted during an ingredient’s production.

Emissions estimates for specific ingredients not represented by Ivanovich et al. (2023) were taken from Clune et al. (2017) and Heller et al. (2018), who report GWP values for over 300 food products. We estimated the breakdown of emissions for these additional ingredients by generalizing the proportions of greenhouse gases emitted for the food categories provided in Ivanovich’s data. Using the individual contributions of carbon dioxide, methane, and nitrous oxide, the Planetary Foodprint Calculator provides both GWP100 and GWP20 values.

greenhouse-gasses-from-industrial-farm-canva-600x600

Land and Water

Land use data was sourced from Poore and Nemecek (2018). Average measurements (e.g., “berries and grapes” or “root vegetables”) were used to estimate the impacts of more specific ingredients (e.g. blueberry or yam). Water use data was also sourced from Poore and Nemecek (2018) and supplemented by global data for specific ingredients using Mekonnen and Hoekstra (2011) for crops and Mekonnen and Hoekstra (2012) for terrestrial animal products. Land-use and water-use data for seafood were taken from Gephart et al. In the case of mushrooms, land-use and water- use data were generalized from the 2017 SureHarvest report on the sustainability of mushroom production. This was verified against an LCA published in collaboration with researchers at UC Davis: Robinson et al. (2017).

High, moderate, and low-impact ingredient groupings were statistically determined for land-use and water-use data using the Fisher-Jenks algorithm (Jenkspy, Python). This algorithm identifies natural breaks in the data, allowing it to be sorted into three categories. Warnings thus correspond to ingredients with high land-use or water-use impacts when compared with the dataset as a whole.

The Planetary Foodprint Calculator emissions data was compiled by Dr. Jennifer Jay, professor of Civil and Environmental Engineering at the University of California, Los Angeles, with the support of students Brian Cook, Polly Kirsch, and Katie Osborn. This full calculator and website have been developed in partnership with the Center for Biological Diversity.

land-and-water-canva-600x600

Serving Sizes and Nutritional Information

Serving sizes were estimated using the U.S. Department of Agriculture (USDA)’s Branded Foods Database (as of September 2025). The database enables the open sharing of nutritional information for products provided by the private food industry. Serving sizes from a minimum of three food providers were averaged to obtain a general estimate by weight for solid foods and by volume for liquid foods. Density conversions for liquid foods were taken from sources including the Food and Agriculture Organization (FAO) Density Database.

The USDA Food and Nutrient Database for Dietary Studies, a database of information compiled from the most recent National Health and Nutrition Examination Survey, was referenced to verify or supplement uncertain serving sizes. Nutritional information provided in the calculator was sourced from the USDA Food Composition Database.

Suggested serving sizes can help estimate quantities of foods likely to be eaten by the average person. However, serving sizes are averages of how people tend to eat, while portion sizes are likely to differ from person to person.

Serving sizes have been growing since the 1970s and differ from the recommendations provided by health agencies. Serving sizes shape the amount of food people eat in a single sitting and can be used as cues for better consumption choices. At the institutional level, the balance of ingredients in buffet offerings or through plate and meal portions can center on climate-friendly options and substitutions.

fresh-vegetables-laid-out-in-a-swirl-with-garlic-press-in-middle-canva-600x600

Keep Exploring

Sources

Burkholder, J., Libra, B., Weyer, P., Heathcote, S., Kolpin, D., Thorne, P. S., & Wichman, M. (2007). “Impacts of Waste from Concentrated Animal Feeding Operations on Water Quality.” Environmental Health Perspectives, 115(2), 308–312. https://doi.org/10.1289/ehp.8839.

Calvin, K., Dasgupta, D., et al. (2023). IPCC, 2023: Climate Change 2023: Synthesis Report. Contribution of Working Groups I, II and III to the Sixth Assessment Report of the Intergovernmental Panel on Climate Change [Core Writing Team, H. Lee and J. Romero (eds.)]. IPCC, Geneva, Switzerland. (First). Intergovernmental Panel on Climate Change (IPCC). https://doi.org/10.59327/IPCC/AR6-9789291691647.

Camilleri, A. R., Larrick, R. P., Hossain, S., & Patino-Echeverri, D. (2019). “Consumers underestimate the emissions associated with food but are aided by labels.” Nature Climate Change, 9(1), 53–58. https://doi.org/10.1038/s41558-018-0354-z.

Cascada, L. L. (2024). “Hundreds of Universities Are Moving Toward a Plant-Based Norm.” Better Food Foundation. https://www.betterfoodfoundation.org/news/hundreds-of-universities-are-moving-toward-a-plant-based-norm/

Center for Biological Diversity. “How cattle contribute to climate change.” https://www.biologicaldiversity.org/programs/population_and_sustainability/pdfs/Cows_Climate_Change_Factsheet.pdf.

Center for Biological Diversity. “How City Food Affects the Environment: Resources for Advocates and Policymakers.“ https://www.biologicaldiversity.org/programs/population_and_sustainability/pdfs/city-food-factsheet.pdf.

Center for Biological Diversity. “Municipal Food and Emissions Guidelines.” https://www.biologicaldiversity.org/programs/population_and_sustainability/pdfs/city-food-factsheet.pdf.

Climate Crisis Advisory Group. Methane: The emergency brake for climate heating. (2025). https://cdn.prod.website-files.com/660df44c73d9da2a5912020a/68d1ca8885dfae4f5873f381_Digital_CCAG_Final_Methane_Report.pdf.

Clune, S., Crossin, E., & Verghese, K. (2017). “Systematic review of greenhouse gas emissions for different fresh food categories.” Journal of Cleaner Production, 140, 766–783. https://doi.org/10.1016/j.jclepro.2016.04.082.

Emery, I., and Molidor, J. (2019). Catering to the Climate: How Earth-Friendly Menus at Events Can Help Save the Planet (p. 17). Center for Biological Diversity. https://www.biologicaldiversity.org/takeextinctionoffyourplate/pdfs/environmental_catering_report_catering_to_the_climate_final_report_2019.pdf.

Hanson, C., Ranganathan, J. (2023). “How to Manage the Global Land Squeeze? Produce, Protect, Reduce, Restore.” https://www.wri.org/insights/manage-global-land-squeeze-produce-protect-reduce-restore.

Harris, F., Moss, C., et al (2020). “The Water Footprint of Diets: A Global Systematic Review and Meta-analysis.” Advances in Nutrition, 11(2), 375–386. https://doi.org/10.1093/advances/nmz091.

Ivanovich, C. C., Sun, T., Gordon, D. R., & Ocko, I. B. (2023). “Future warming from global food consumption.” Nature Climate Change, 13(3), 297–302. https://doi.org/10.1038/s41558-023-01605-8.

Gephart, J. A., Henriksson, P. J. G., Parker, R. W. R., Shepon, A., Gorospe, K. D., Bergman, K., Eshel, G., Golden, C. D., Halpern, B. S., Hornborg, S., Jonell, M., Metian, M., Mifflin, K., Newton, R., Tyedmers, P., Zhang, W., Ziegler, F., & Troell, M. (2021). “Environmental performance of blue foods.” Nature, 597(7876), 360–365. https://doi.org/10.1038/s41586-021-03889-2.

Heller, M. C., Willits-Smith, A., Meyer, R., Keoleian, G. A., & Rose, D. (2018). “Greenhouse gas emissions and energy use associated with production of individual self-selected US diets.” Environmental Research Letters, 13(4), 044004. https://doi.org/10.1088/1748-9326/aab0ac.

Levitsky, D. A., & Youn, T. (2004). “The More Food Young Adults Are Served, the More They Overeat.” The Journal of Nutrition, 134(10), 2546–2549. https://doi.org/10.1093/jn/134.10.2546.

Mekonnen, M. M., & Hoekstra, A. Y. (2011). “The green, blue and grey water footprint of crops and derived crop products.” Hydrology and Earth System Sciences, 15(5), 1577–1600. https://doi.org/10.5194/hess-15-1577-2011.

Mekonnen, M. M., & Hoekstra, A. Y. (2012). “A Global Assessment of the Water Footprint of Farm Animal Products.“ Ecosystems, 15(3), 401–415. https://doi.org/10.1007/s10021-011-9517-8.

Morgenstern, S., Redwood, M., & Herby, A. (2024). “An Innovative Program for Hospital Nutrition.” American Journal of Lifestyle Medicine, 19(2), 320–323. https://doi.org/10.1177/15598276241283158.

Mushroom Council. The Mushroom Sustainability Story: Water, Energy, and Climate Environmental Metrics (p. 10). (n.d.). SureHarvest. https://www.mushroomcouncil.com/wp-content/uploads/2017/12/Mushroom-Sustainability-Story-2017.pdf

Poore, J., & Nemecek, T. (2018). “Reducing food’s environmental impacts through producers and consumers.” Science, 360(6392), 987–992. https://doi.org/10.1126/science.aaq0216

Reid, Walter V., Harold A., et al. (2005). Ecosystems and human well-being: Synthesis. Millennium Ecosystem Assessment. Island Press. https://www.millenniumassessment.org/documents/document.356.aspx.pdf.

Robinson, B., Winans, K., et al. (2019). “A life cycle assessment of Agaricus bisporus mushroom production in the USA.” The International Journal of Life Cycle Assessment, 24(3), 456–467. https://doi.org/10.1007/s11367-018-1456-6

Rost, S., Gerten, D., et al. (2008). “Agricultural green and blue water consumption and its influence on the global water system.” Water Resources Research, 44(9). https://doi.org/10.1029/2007WR006331.

Searchinger, T., and Waite, R. et al. (2019). Creating a sustainable food future: A menu of solutions to feed nearly 10 billion people by 2050. WRI. https://www.wri.org/publication/creating-sustainable-food-future-final-report

Stone, E. (2025). “Moving to plant-based foods: LA County expanding program to cut down on emissions.” LAist. https://laist.com/news/climate-environment/plant-based-foods-la-county-expanding-program-emissions.

Wansink, B., & Kim, J. (2005). “Bad Popcorn in Big Buckets: Portion Size Can Influence Intake as Much as Taste.” Journal of Nutrition Education and Behavior, 37(5), 242–245. https://doi.org/10.1016/S1499-4046(06)60278-9

Willett, W., Rockström, J., et al. (2019). “Food in the Anthropocene: The EAT–Lancet Commission on healthy diets from sustainable food systems.” The Lancet, 393(10170), 447–492. https://doi.org/10.1016/S0140-6736(18)31788-4

Young, L. R., & Nestle, M. (2002). “The Contribution of Expanding Portion Sizes to the US Obesity Epidemic.” American Journal of Public Health, 92(2), 246–249. https://doi.org/10.2105/AJPH.92.2.246

Zhang, A. W., Wharton, C., et al. (2024). “Changing the default meal option at university events to reduce harmful environmental impacts: Six randomized controlled trials.” Appetite, 200, 107572. https://doi.org/10.1016/j.appet.2024.107572.